
Overview
Znode Reporting provides native integration with Microsoft Power BI, allowing business users and administrators to view and analyse e-commerce data through interactive BI reports. Using the BI Reports section in the Admin Console, users can access preconfigured Znode reports powered by Power BI to track orders, revenue, customers, and operational trends.
This article explains how to access and view Power BI reports in Znode and understand the available dashboards and metrics.
Prerequisites
Before viewing Power BI reports, ensure the following:
- Access to the Znode Admin Console is available
- The assigned role includes permission to view Reporting and BI Reports
- Power BI integration is enabled and configured for the Znode environment
- A valid Power BI account is associated with the environment
Power BI configuration and authentication are typically completed by an administrator. Business users are not required to configure data connections.
Accessing Power BI Reports in Znode
Steps
- Sign in to the Znode Admin Console.
- From the top navigation menu, select Reporting.
- Select BI Reports.
Outcome
The Power BI Reports landing page is displayed, showing available report categories.
Viewing Znode Reports
Znode provides native reports designed for common ecommerce reporting and analysis.
Steps
- On the Power BI Reports page, locate the Znode Reports section.
- Select View Report.
Outcome
The Znode Reports dashboard opens within the Admin Console, displaying embedded Power BI visualisations.

Understanding the Znode Reports Dashboard
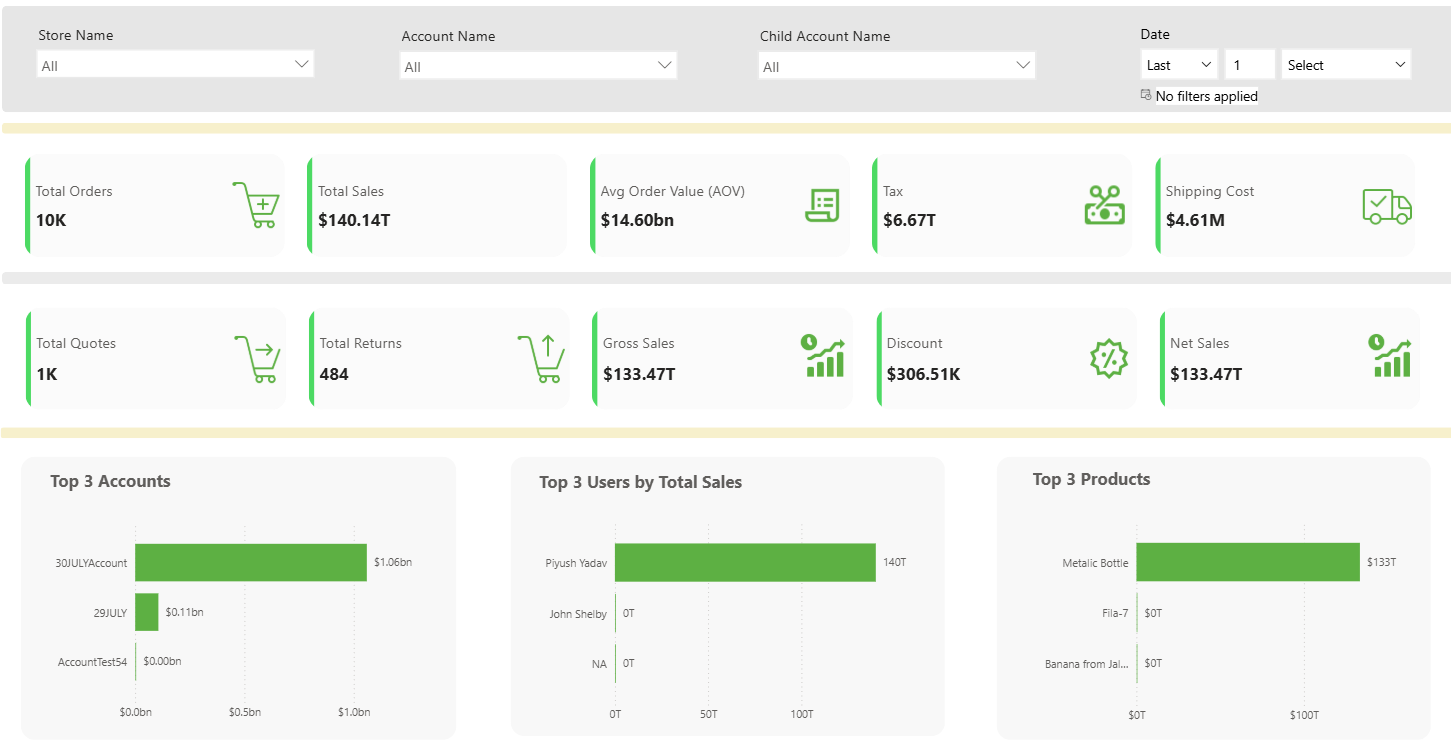
The Znode Reports Dashboard provides a centralized view of B2B sales performance across Stores, Accounts, Child Accounts, Buyers, and Products. The dashboard enables Customers to monitor sales activity, evaluate account performance, and identify revenue trends using configurable filters and key performance indicators (KPIs).
The dashboard includes the following global filters:
- Store Name
- Account Name
- Child Account Name
- Date
All KPI cards and ranking sections respond to the selected filter combination, ensuring that all dashboard data reflects the same reporting scope.
Dashboard KPIs
The dashboard displays the following KPIs.
Primary KPI Row
- Total Orders
- Total Sales
- Average Order Value
- Tax
- Shipping
Secondary KPI Row
- Total Quotes
- Total Returns
- Gross Sales
- Discounts
- Net Sales
The primary KPI row provides a high-level view of order volume and sales performance, while the secondary KPI row provides detailed sales calculations and Customer activity metrics.
Understanding Dashboard Filters
Store Name
The Store Name filter allows reporting across all authorized Stores or a specific Store.
- Selecting All includes data from all authorized Stores.
- Selecting a specific Store limits results to that Store.
- Available Accounts are automatically updated based on the selected Store.
- Unauthorized Stores are not displayed.
Account Name
The Account Name filter represents the parent B2B Account.
- Selecting All includes all authorized Accounts within the selected Store scope.
- Selecting a specific Account displays activity associated with that Account.
- When Child Account is set to All, activity from eligible Child Accounts is included in the parent Account totals.
- Available Child Accounts are updated based on the selected Account.
Child Account Name
The Child Account Name filter provides access to Child Account reporting.
- The filter becomes available after selecting a parent Account.
- Selecting All includes the parent Account and all eligible Child Accounts.
- Selecting a specific Child Account displays only activity associated with that Child Account.
- Child Accounts can only be selected within their associated parent Account hierarchy.
Date
The Date filter supports relative date selection to analyze historical performance.
Examples include:
- Last 7 Days
- Last 4 Weeks
- Last 3 Months
- Last 1 Quarter
- Last 1 Year
Supported time units include:
- Days
- Weeks
- Weeks (Calendar)
- Months
- Months (Calendar)
- Years
- Year (Calendar)
Only positive whole numbers are supported when defining a relative date range.
Common B2B Reporting Scenarios
Analyze Sales Performance for a Customer Account
Sales teams and account managers frequently review purchasing activity for a specific Customer Account and its associated Child Accounts. This scenario helps evaluate revenue contribution, buying trends, and overall account performance.
- Open the Dashboard.
- Select the required Store from the Store Name filter.
- Select a parent Account from the Account Name filter.
- Leave Child Account Name set to All to include activity from eligible Child Accounts.
- Select the required Date range.
- Apply the filters.
The dashboard displays:
- Total Orders generated by the selected Account hierarchy.
- Total Sales for the selected Account.
- Gross Sales, Discounts, and Net Sales.
- Tax and Shipping values.
- Quote and return activity.
- Top-performing Buyers within the selected Account.
- Top-performing Products purchased by the selected Account.
This view provides a consolidated representation of purchasing activity across the entire Account structure.
Identify Top-Performing Accounts, Buyers, and Products
Business users frequently analyze rankings to identify revenue-generating Customers, high-value Buyers, and best-selling Products. These insights support account planning, sales strategy, and Customer engagement initiatives.
- Open the Dashboard.
- Select the required Store, Account, Child Account, and Date filters.
- Apply the filters.
- Review the Top 3 ranking sections.
The dashboard displays:
- Top 3 Accounts ranked by Total Sales.
- Top 3 Users ranked by Total Sales.
- Top 3 Products ranked by Net Sales.
These rankings help organizations:
- Identify strategic Customers.
- Recognize high-value Buyers.
- Monitor product demand and purchasing trends.
- Evaluate sales performance across Accounts.
- Support account growth and retention initiatives.
All ranking sections automatically update when filters change, ensuring that results accurately reflect the selected reporting scope.