
TABLE OF CONTENTS
Dashboard
The Dashboard provides a consolidated view of the execution health and overall status of all Commerce Connector Data Exchanges. It enables administrators to monitor execution activity, identify failures, analyze processing times, and quickly navigate to execution details without opening individual data exchanges.
The dashboard summarizes successful and failed executions, execution duration, and recent failed workflows, providing a centralized monitoring experience for Commerce Connector.
Accessing the Dashboard
Navigation: Commerce Connector > Dashboard
The Dashboard displays execution statistics based on the selected time period.
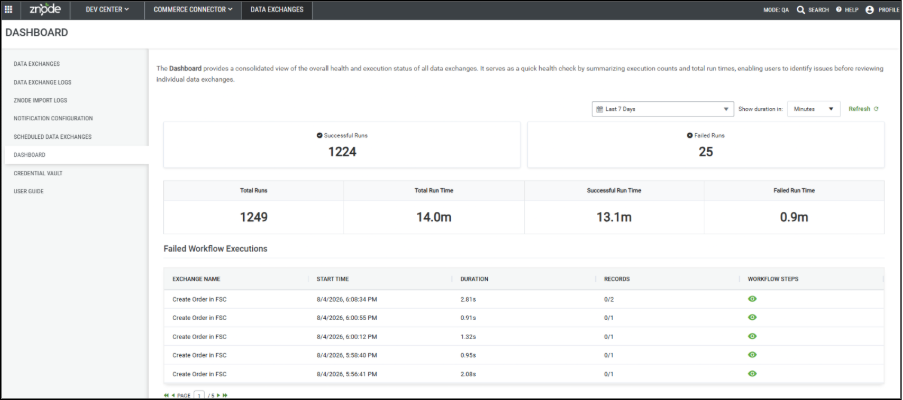
Dashboard Filters
Date Range
Use the Date Range filter to display execution statistics for a specific time period.
- Last 24 Hours
- Last 7 Days
- Last 30 Days
- Custom Date Range (if configured)
All dashboard metrics update automatically based on the selected date range.
Show Duration In
Use the Show Duration In dropdown to display execution duration in the preferred unit.
- Seconds
- Minutes
- Hours
All duration-related metrics are updated based on the selected unit.
Refresh
Select Refresh to retrieve the latest execution statistics without changing the selected filters.
Dashboard Summary
The Dashboard displays the following execution summary cards.
Successful Runs
Successful-Runs displays the total number of successfully completed Data Exchange executions during the selected time period.
Selecting this card opens the Data Exchange Logs page filtered to display only successful executions.
Failed-Runs
Displays the total number of failed Data Exchange executions during the selected time period.
Selecting this card opens the Data Exchange Logs page filtered to display only failed executions.
Total Runs
Displays the total number of Data Exchange executions performed during the selected time period.<
Total Run Time
This value includes both successful and failed executions.
- Formula:
Total Executions = Successful Runs + Failed Runs - Total Run Time
- Displays the cumulative execution time for all Data Exchange executions within the selected period.
- This value includes the execution duration of both successful and failed executions.
Successful Execution Time
- Displays the cumulative execution time consumed by successfully completed executions.
- This metric helps evaluate the overall processing time for successful workflows.
Failed Execution Time
- Displays the cumulative execution time consumed by failed executions.
- This helps identify the amount of processing time spent on unsuccessful executions.
Failed Workflow Executions
The Failed Workflow Executions section lists the most recent failed Data Exchange executions.
The grid provides quick visibility into failed workflows without navigating to the complete execution logs.
Column Description Exchange Name Name of the Data Exchange that failed. Start Time Date and time when execution started. Duration Total execution duration before completion or failure. Records Number of processed, successful, and failed records. Workflow Steps Opens the detailed Execution History for the selected execution. Viewing Execution Details
Select the View icon in the Workflow Steps column to open the detailed Execution History for the selected execution.
The Execution History displays step-level information, including request and response details for each transmission step.
Execution History
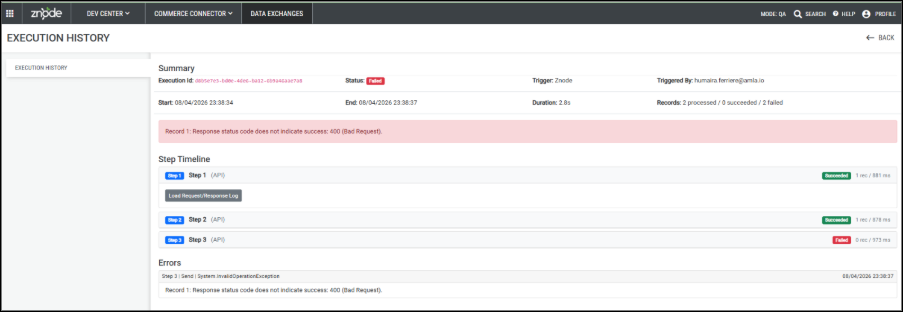
The Execution History page provides complete visibility into the execution of a Data Exchange workflow. It displays execution metadata, overall status, error information (if applicable), and detailed information for every workflow step executed.
Execution History is available for both successful and failed executions.
Summary Section
The Summary section displays high-level execution information.
Field Description Execution Id Unique identifier generated for the execution. Status Overall execution status (Succeeded or Failed). Trigger Indicates how the execution was initiated (for example, Znode, Scheduler, Event, or API). Triggered By User or system that initiated the execution. Start Time Execution start date and time. End Time Execution completion date and time. Duration Total execution duration. Records Number of processed, successful, and failed records. Error Summary
For failed executions, an error banner is displayed below the Summary section.
The banner provides the primary failure reason, such as:
- HTTP status code failures
- Dependency step failures
- Validation failures
- Processing exceptions
This allows administrators to quickly identify why the execution failed before reviewing the individual workflow steps.
Step Timeline
The Step Timeline displays every workflow step executed during the Data Exchange.
Each step can be expanded to review its execution details.
Section Description Step Name Name and sequence of the executed step. Step Status Indicates whether the step completed successfully or failed. HTTP Status Code Response code returned by the endpoint (for API steps). Execution Duration Time taken to execute the step. Records Number of records processed during the step. Request Headers HTTP request headers sent to the endpoint. Sensitive values such as authorization tokens are masked. Request Body Complete request payload sent during execution. Response Response received from the destination endpoint. Step Status Indicators
Each workflow step displays its execution status.
Possible statuses include:
- Succeeded
- Failed
- Skipped (when applicable)
This enables administrators to quickly identify which step caused a workflow failure.
Monitoring Failed Executions
The Dashboard and Execution History together provide a complete monitoring experience.
Administrators can:
- Monitor successful and failed executions from a single dashboard.
- View execution counts and execution durations.
- Filter execution statistics by date range.
- Open successful or failed execution logs directly from the summary cards.
- Review recently failed workflows.
- Open detailed execution history for any workflow.
- Analyze request headers, request bodies, responses, execution duration, and HTTP status codes for every workflow step.
- Quickly identify the exact step responsible for a workflow failure.
- Use the execution details to troubleshoot configuration, mapping, or endpoint issues efficiently.
This centralized monitoring capability simplifies troubleshooting and provides complete visibility into Commerce Connector Data Exchange executions.
Important Notes
- Execution history is available only for multi-step data exchanges
- Execution history is not available for Data Exchanges that use a Custom Processor.